Running
This page is all about running, about world records from sprint to ultra marathon but also about what everybody might be able to achieve. It is organized reversely with the result at the beginning. And the result is a running time prediction calculator, which you can find HERE.
Note: if any of the formula images are too small, click on them and they will be shown enlarged.
The equation that is applied is
![]()
with the average running speed v, the distance S; S0 as a parameter to get rid of the dimension (meter) I chose it to be S0 = 100 m and v0 to get the dimension of speed. a and b are parameters to be gauged from data, i.e. known running times for two different distances. They are dimensionless numbers due to the construction of the rest of the equation. v0 does not necessarily have to be the speed with which you can run the distance S0, but if it is then b = 1. Still, it might be simpler to use v0 = 1 km/min or v0 = 1 m/s.
In case v0 belongs to S0 then by knowing another data pair (v1, S1) one can calculate a and gets
![]()
This might look a bit complicated, and in the general case it becomes even more complicated for the closed form equations for the running time T itself, but there is one case, where from the last equation trivially one receives a simple relation for running times: if you know your running time for one distance S0 and a second distance, which is twice as long: S1=2S0, then you can calculate the running time for the distance, which is four times as long (S2=4S0) as
![]()
Before turning to the data that supports these equations, here are all six relations for the general case (no special relation between S0 and S1 and v0 does not necessarily belong to S0):

Here LW is the Lambert W function.
When I first was thinking about such a relation and from my own running times had this idea, the first data I could grab were the world records as shown in figures 1 and 2 (world records of all following diagrams are as of January 2010).
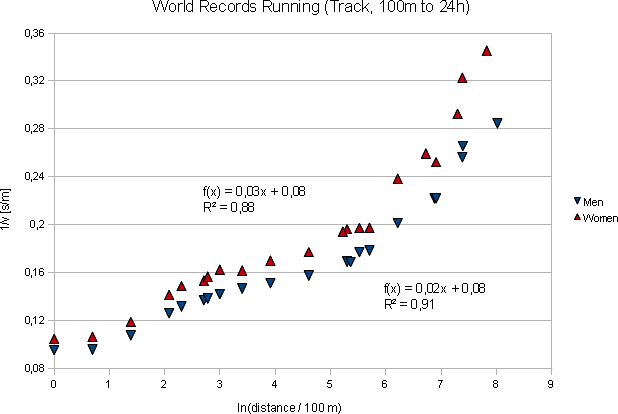
Fig. 1: Running World Records on the track, displayed 1/speed vs. ln(distance/100m).
The two functions are the result of linear regressions.
In my eyes there are at least three ranges of running distances:
1) Sprint (100 m to 400 m)
2) Non-sprint Olympic range and especially Olympic disciplines (800 m to marathon)
3) Ultra marathon.
Olympic middle and long distances and ultra marathon are different in more than just the fact that ultra marathon runs and takes even longer. Competing in the Olympic disciplines means that you can earn much more attention, money, and recognition. This means that fewer people try to compete in non-Olympic disciplines than Olympic disciplines, that talent sighting is far less organized, and that there is by far less support for ultra marathon runners than for Olympic athletes. There are only very few professional ultra marathon runners, if any. And while you can make maybe 100 serious attempts per year at 800 m really fast and maybe 3 attempts at marathon, there are only very few people who can make more than one serious ultra marathon run per year (although I know there are a few). And if then you do not have your best day - bad luck, wait another year.
All this in summary leads to the effect that the potential of the human body to run a distance really fast may have been best probed for 800 m (everyone has to do it in school and a teacher might suggest to a talent to join a club and train seriously). It may still have been tested quite well for marathon but then much less for any distance longer than marathon. There have been rumors going on that a race over 100 km will be part of the Olympics. Should this happen, the situation will change up to this distance.
Therefore we have to assume that even if there is a common law that describes the running time in dependence of distance from 800 m to 300 km, it does not yet show in the data.
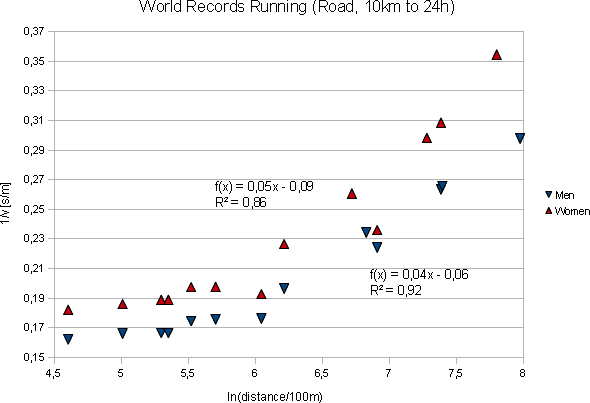
Let's therefore concentrate on the Olympic distance range. Figures 3 and 4 show the world records on track and street.
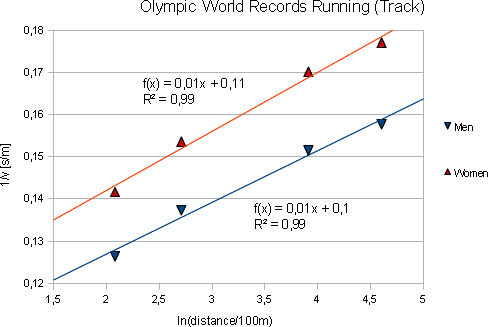

Fig. 4: World records for street competitions on 10 km, half marathon and marathon.
Two questions remain: does the initial equation really fit well the individual performances? And what's the reason for the positive curvature for male street runners?
For the first question see figure 5 at the end of this page. There, data of individual runners is shown who have publised their personal bests on the web. In most cases the initial equation fits the data very well. There are a number of conditions which can be told a priori, which is needed if the initial equation is to give good predictive results: A runner must check his personal best times frequently. It does not help if some data is up to data and others are not. Furthermore frequently checking the personal best time guarantees that the personal bests really give what is possible for the runner. And third: a runner must train for the distance which he is predicting his best time for. Only training 400 and 800 meter sprints might show you what you could reach in marathon, but it probably will not enable you to realize that potential. And a last thing: having been predicted your potential does not mean that you can realize your potential at the first attempt. It might well be that you will finish your first marathon 20 minutes later than has been predicted, just because it may not have been your best day.
Now for the second question: Samuel Wanjiru, who has been running that fabulous half marathon world record in 2007 at the age of just 20, has not yet been competing in the Berlin marathon - the track on which the latest three world best times were run (and by this each and every official world record). At present (Jan 2010) Wanjiru holds the course records in London and Chicago, and already has announced to compete in Berlin in 2010. So, it might simply be that Wanjiru is even more talented than Gebreselassie and just has not made the attempt to grab the world record. But - as in recent years - for the first time there have been a number of runners younger than 25 years with very good marathon performances - maybe the better explanation is that nowadays young African runners are better trained (especially they are not over-trained until they perish) than they once were. Nowadays young African runners are trained by African trainers not by Europeans anymore. These trainers may have this last bit of cultural empathy that the Europeans lack. Who knows? Anyway, Wanjiru has claimed that he was able to run a "low 2:03" (the current world record by Gebreselassie is 2:03:59). From his personal bests over 10 km (26:41,75) and 21.1 km (58:33) I would even calculate 2:01:13. But his 10 km best is from 2005 and might be outdated. If he's now able to run faster over 10,000 m, the prediction for marathon would be less optimistic, but even if he was able to exactly reach the world record for 10,000 m, the prediction would be 2:02:47, and predicting his marathon time by using his VO2max value calculated from his half marathon time gives a 2:02:41. So it might even be that he did his claim "low 2:03" to be on the safe side. I'm looking forward to Berlin 2010. [Edit: Meanwhile the race is over and Wanjiru could not participate, as he was injured, so we'll have to wait another year.]
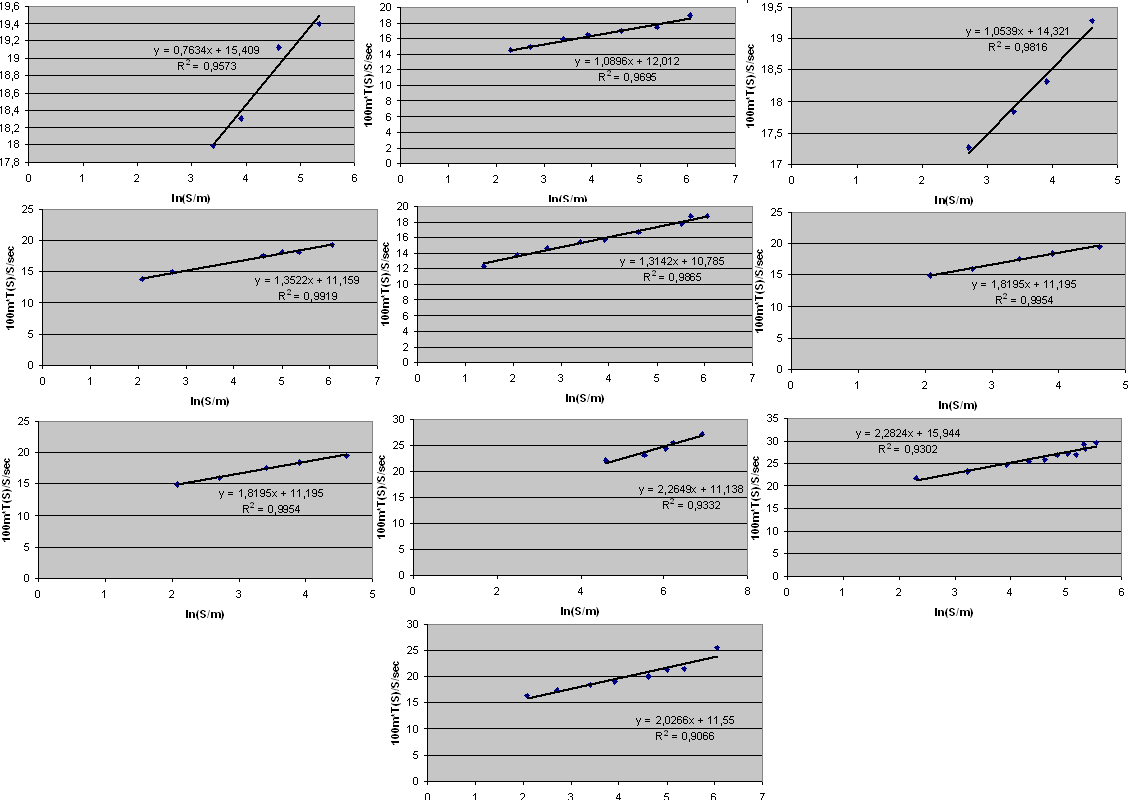
Fig. 5: (Click to enlarge.) Individual performance data found on the web. The dimension constants are chosen a bit different than in the rest of this page, but this should not obscure the fact that the initial equation fits well the data of most runners. Every runner who has been found publishing his personal bests on the web has been included in the set. So this is not a selected sub-sample.